Lesson
Every data center has one drawing that matters most: the single-line diagram. One line traces power from the utility to the server racks through every device it passes through. Engineers read it as a design. Procurement should read it as a shopping list. Every symbol on that line is a package: its own vendors, its own specification, its own lead time, its own purchase order. This lesson teaches the chain by reading two real drawings of the same design, one early and simple, one later and complete.
How to read any single-line diagram. Four habits carry you through almost any drawing in this industry:
- Start at the top. The utility source and the highest voltage sit at the top or the left. Work down, following one path at a time.
- Symbols are nouns. Two coils are a transformer. A circle is a generator. A break in the line with a rating beside it is a breaker. A stack of short and long lines is a battery. You do not need the full symbol library to follow the story.
- Numbers are ratings. A label like 3000A 3P or 2500 kVA is a size, and sizes are procurement facts. They decide what gets bought and what it costs.
- Heavy horizontal lines are buses. A bus is the shared conductor inside a switchboard that collects power and hands it out through breakers. Where two buses meet, look for the tie breaker.
The project. Compass Data Centers builds standardized modular data centers around a Modular Power Center (MPC): the switchboard, UPS systems, and generator for a data hall, packaged as one repeatable 1.2 MW unit. A hall runs on two of them. Uptime Institute Journal published the design in 2014, engineered to Tier III. The article prints the electrical single-line diagram twice: at schematic design, when the design is still a concept, and at design development, when it is becoming a system someone can buy and build. Reading both is the whole lesson.
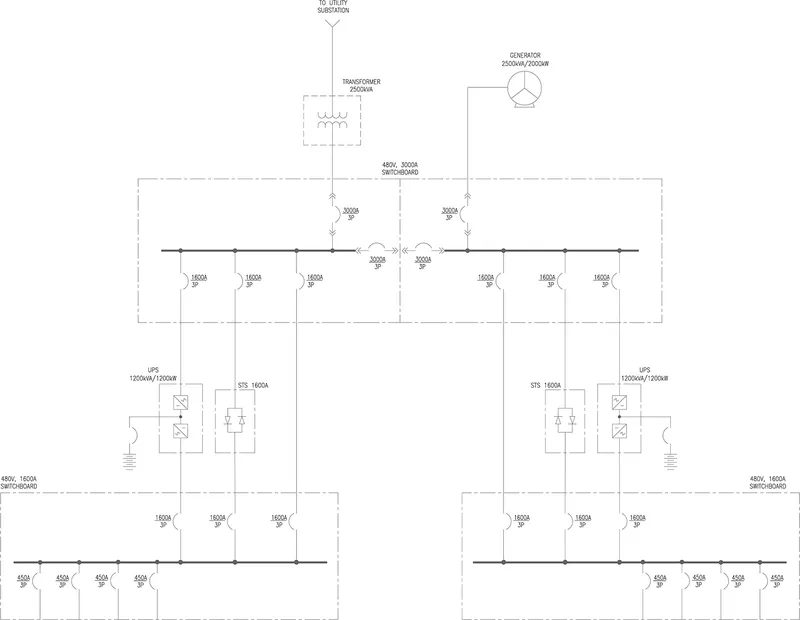
Figure 1. Schematic design single-line diagram, one Modular Power Center. From Data Center Facility Owners See Modules as Efficient Way to Deploy Capital, Uptime Institute Journal (2014). Copy stored in the Knowledge Base assets folder.
Reading 1: the schematic. Work it top to bottom:
- The head. One utility feed ("TO UTILITY SUBSTATION") and one 2500 kVA transformer. The substation itself sits off the top of the drawing, on the utility's side of the fence. The transformer is where the site's chain begins, and this design steps down once, right there. There is no MV switchgear lineup inside the building; everything downstream of the transformer is low voltage. One feed, one transformer. Hold that thought.
- The second head. Top right, a generator, 2500 kVA / 2000 kW, landing on the same switchboard. Standby power enters at the main board, not somewhere downstream.
- The main switchboard. The heavy horizontal line inside the dashed box: 480V, 3000A. It is drawn as two halves joined at the center by two 3000A tie breakers. Either half can be de-energized and serviced while the other carries the load. That is concurrent maintainability, drawn instead of promised.
- The ratings ladder. 3000A mains at the board, 1600A feeders leaving it, 450A breakers at the bottom edge. Ratings shrink as power descends, and every step down is a package boundary.
- The UPS and the bypass. Each half of the board feeds a UPS, 1200 kVA / 1200 kW (the battery drawn beside it is the bridge across generator start time) and a 1600A STS, a static transfer switch. Each 480V, 1600A distribution switchboard at the bottom can be reached three ways: from its UPS, from the STS, or by a feeder straight off the main bus. Normal path, alternate path, bypass path. Compass specifies static UPS, batteries plus power electronics. The chain's other UPS architecture is rotary DRUPS, which swaps the battery for kinetic storage and a diesel engine; the Reference defines both.
Now grade the drawing. A redundancy table printed with the article scores this design, system by system:
- Utility: N. One feed, one transformer, no spare.
- Main switchboards, UPS, STS bypass, distribution switchboards: 2N. Doubled.
- Generators: N+1.
The head of the chain is single while everything under it is doubled. That is a deliberate Tier III economics decision, and you can only see it by reading the drawing against the table. A chain is only as redundant as its least redundant link. How much redundancy to buy, and what it costs, is 01.30's subject. Here it is enough to see where the doubling starts and where it stops.
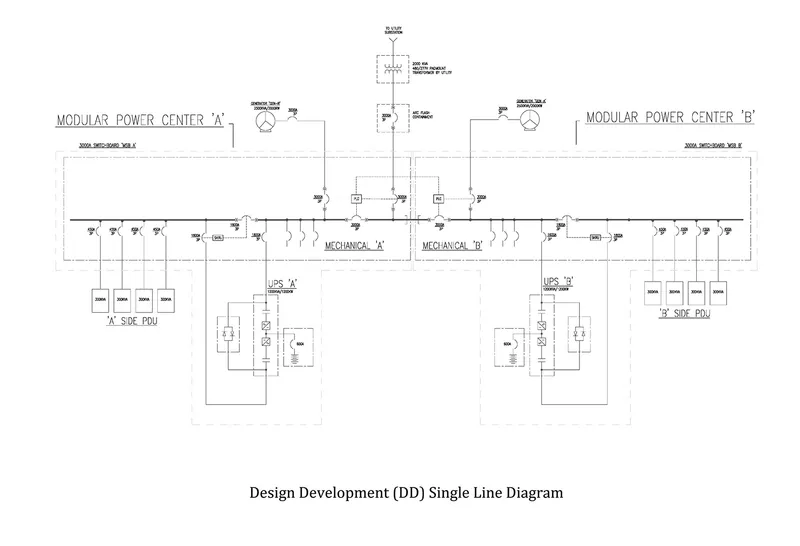
Figure 2. Design development (DD) single-line diagram, the same design with both Modular Power Centers drawn. Figure 12 in the original article. Uptime Institute Journal (2014). Copy stored in the Knowledge Base assets folder.
Reading 2: the same chain, grown. The chain's logic did not change between the two drawings. Watch what the drawing gained:
- Duplication. One power center became two, Modular Power Center A and B, tied at the center, each with its own generator. The 2N that the schematic stated in a table is now drawn as hardware.
- Ratings moved. The utility transformer is now a 2000 kVA padmount unit, supplied by the utility, and the utility breaker sits in arc flash containment. Schematic numbers are placeholders. Design development numbers are commitments. Do not fall in love with the first set.
- The UPS opened up. The box labeled UPS in Figure 1 is now drawn from inside: rectifier, inverter, static bypass switch, and the battery on its own 800A breaker. One box became several buys and a maintenance question.
- Loads appeared. Sections of each switchboard are labeled Mechanical A and Mechanical B, because cooling rides the same boards. The bottom of the drawing names the endpoints the schematic never reached: four 300 kVA PDUs per side, each on a 450A breaker.
- Control lines appeared. The dashed lines running to the PLC boxes at the center tie carry no power. They are the controls that decide when ties close and generators start. A single-line diagram shows control as well as copper, and controls are a package too.
Between schematic design and design development, a drawing gains exactly what procurement ends up buying: detail, duplication, controls, and ratings that can be ordered against.
Every conversion is a tax. Each time the line passes through a box in these drawings, power changes form or voltage: stepped down at the transformer, rectified and inverted inside the UPS, split into smaller circuits at every board. Each conversion costs equipment, floor space, and efficiency, which is why the PUE from 01.10 is really a report card on this chain. Engineers keep the chain as short as physics and safety allow. Every link that remains is a separate buy.
The chain keeps getting shorter. The drawings above are from 2014, and it shows. Since then, distribution voltages stepped up from 208 to 480 and then 415 volts, and the newest high-density halls carry medium voltage almost to the row before the final step-down. Each deletion removes a transformer package, a set of conversion losses, and a slice of PUE. The buying implication is direct: fewer links, fewer packages, fewer factory queues to stand in.
The box that scares veterans is the UPS. Ask an operations veteran which box worries them and they will not say the generator. Uptime Institute's 2025 outage analysis says the same. Among outages stemming from a power issue:
- UPS failures: 42 percent, the leading cause.
- Transfer switch failures: 36 percent.
- Generator failures: 28 percent.
The UPS touches every watt on its way to the servers, conditioning power continuously and bridging the seconds between utility failure and generator start. A UPS failure does not degrade the building. It drops the load. That is why veterans spend their scrutiny on the UPS package: the batteries, the architecture, the maintenance regime.
Chain order is not factory order. Ask a veteran procurement manager when to release the packages and you will hear the scar tissue.
- Chain order, the default: upstream first, because downstream ratings depend on upstream decisions.
- Factory order, the real rule: longest lead time first. The transformer order goes out before the design is finished, because the factory queue does not care about your drawings.
That tension is where schedules are won and lost. The lead-time side of it is taught in 01.40.
Generators insure; they do not supply. The generator is the strangest package in the building: bought in the hope it never runs, maintained as if it runs every day. Fuel kept polished, block heaters kept warm, monthly tests run under load, because the only question that matters is whether it starts in seconds after sitting idle for months. And the engine is only half the package. The transfer switch decides, in milliseconds, that the utility is gone and the generator must take the load. A generator that starts thirty seconds late is a very expensive sculpture. How much insurance, and in what configuration, is 01.30's subject.
What a second chain is worth. When U.S. Bank replaced the switchgear and UPS systems in its live St. Paul data center, it could not de-energize a bank, so it built a temporary stand-alone power plant in the parking lot and cut every load across over two weekends, with no impact to the facility (the article is in Further reading). You can only do open-heart surgery like that on a system you can draw on one line. The chain is the project.
Reference
The chain, link by link
- Single-line diagram: the electrical drawing that traces power from the utility feed to the racks through every device in the chain. Procurement reads it as the package list.
- Utility feed: the grid connection. Power availability and the energization date set project feasibility.
- Substation: where high-voltage grid power is stepped down for the site. Substation transformers are the longest-lead package in the matrix (100-140 weeks).
- MV switchgear: the assembly of breakers and controls that distributes and protects power at medium voltage.
- Step-down transformer: steps voltage down between stages of the power chain, here from medium voltage to low voltage.
- LV distribution: low-voltage switchgear and distribution boards spreading power from the transformers to the halls.
- Switchboard: a free-standing assembly of busbars, breakers, and switches that divides one large incoming feed into smaller outgoing circuits. The main distribution point at low voltage.
- Tie breaker: a breaker joining two bus sections or two switchboards. Closing it lets one side carry the other through a failure or a maintenance shutdown.
- UPS (Uninterruptible Power Supply): battery-backed power bridging utility failure to generator start; also conditions power. Two architectures: static (batteries plus power electronics) and rotary/DRUPS (a diesel engine paired with kinetic storage, no batteries).
- Busway / busduct: prefabricated overhead electrical distribution allowing tap-offs along its length.
- PDU (Power Distribution Unit): distributes power to racks in the data hall.
- RPP (Remote Power Panel): panel distributing power to rows of racks.
- iPDU (intelligent PDU): rack-level distribution with per-outlet metering and switching. The chain ends here: busway feeds PDUs and RPPs, which feed iPDUs at the rack.
- ATS / STS (Automatic / Static Transfer Switch): switches load between sources; static is solid-state and faster.
- Generator / genset: on-site backup generation, typically diesel at 2.5-3.3 MW per unit. The standby source, started by the transfer switch; insurance, not supply.
Reading the Compass diagrams
Compass Data Centers' modular design, as published by Uptime Institute Journal (2014). One design, drawn at two stages:
- Figure 1 (schematic design) shows one Modular Power Center: utility feed, 2500 kVA transformer, 2500 kVA / 2000 kW generator, one 480V 3000A main switchboard drawn as two halves joined by two 3000A tie breakers, two 1200 kVA / 1200 kW UPS systems, two 1600A STS bypasses, two 480V 1600A distribution switchboards, 450A branch breakers.
- The article's redundancy table (its Figure 2) scores the design: utility N; main switchboards, UPS, STS bypass, and distribution switchboards 2N; generators N+1.
- Figure 2 (design development; Figure 12 in the original article) shows both power centers, A and B: a 2000 kVA utility padmount transformer, arc flash containment at the utility breaker, a generator per center, PLC controls on the center tie, mechanical sections on each switchboard, UPS internals drawn (rectifier, inverter, static bypass, battery on an 800A breaker), and four 300 kVA PDUs per side.
- The schematic states intent and topology. The design development drawing states ratings, controls, and loads. The distance between the two is the procurement program.
The buying read
- Each link is a package: a separately procured scope of equipment with its own vendors, specification, and lead time. The single-line diagram is the package list.
- Default release order follows the chain, upstream first. Modified by lead time: the longest-lead packages release early, even ahead of finished design.
- Every conversion point costs efficiency. The length of the chain shows up in PUE.
- The chain is also the failure chain. Every link is a single point of failure until redundancy is added, which is 01.30's subject.
The vocabulary
- ATS / STSAutomatic / Static Transfer Switch
- switches load between sources; static is solid-state and faster.Taught in 01.20 The Power Chain, End to End
- Busway / busduct
- prefabricated overhead electrical distribution allowing tap-offs along its length.Taught in 01.20 The Power Chain, End to End
- DRUPSDiesel Rotary UPS
- backup power combining a diesel engine with a kinetic (flywheel) energy store — no batteries. Lower footprint and maintenance than static UPS; different cost and service profile.Taught in 01.20 The Power Chain, End to End
- Generator / genset
- on-site backup generation, typically diesel at 2.5-3.3 MW per unit (70-100 weeks).70-100 weeksTaught in 01.20 The Power Chain, End to End
- iPDUintelligent PDU
- rack-level distribution with per-outlet metering and switching.Taught in 01.20 The Power Chain, End to End
- LV distribution
- low-voltage switchgear and distribution boards spreading power from the transformers to the halls.Taught in 01.20 The Power Chain, End to End
- MV / LVMedium / Low Voltage
- the distribution voltage classes inside the facility.Taught in 01.20 The Power Chain, End to End
- Package
- a separately procured scope of equipment. One link of the power chain with its own vendors, specification, and lead time.Taught in 01.20 The Power Chain, End to End
- PDUPower Distribution Unit
- distributes power to racks in the data hall.Taught in 01.20 The Power Chain, End to End
- RPPRemote Power Panel
- panel distributing power to rows of racks.Taught in 01.20 The Power Chain, End to End
- Single-line diagram
- the electrical drawing that traces power from the utility feed to the racks through every device in the chain. Procurement reads it as the package list.Taught in 01.20 The Power Chain, End to End
- Substation
- where high-voltage grid power is stepped down for the site. Substation transformers are the longest-lead package in the matrix (100-140 weeks).100-140 weeksTaught in 01.20 The Power Chain, End to End
- Switchboard
- a free-standing assembly of busbars, breakers, and switches that divides one large incoming feed into smaller outgoing circuits. The main distribution point at low voltage.Taught in 01.20 The Power Chain, End to End
- Switchgear
- the assembly of breakers and controls that distributes and protects power at MV or LV.Taught in 01.20 The Power Chain, End to End
- Tie breaker
- a breaker joining two bus sections or two switchboards. Closing it lets one side carry the other through a failure or a maintenance shutdown.Taught in 01.20 The Power Chain, End to End
- Transformer
- steps voltage up or down between stages of the power chain.Taught in 01.20 The Power Chain, End to End
- UPSUninterruptible Power Supply
- battery-backed power bridging utility failure to generator start; also conditions power. 52-70 weeks.52-70 weeksTaught in 01.20 The Power Chain, End to End
- Utility feed
- the grid connection. Power availability and the energization date set project feasibility.Taught in 01.20 The Power Chain, End to End
Further reading
- Uptime Institute Journal (2014), Data Center Facility Owners See Modules as Efficient Way to Deploy Capital: the Compass Data Centers modular design this lesson reads. This lesson's Figures 1 and 2 are its schematic and design development single-line diagrams (Figures 1 and 12 in the original article); the redundancy table quoted in the Lesson is its Figure 2.
- TechTarget, Data center power infrastructure essentials prevent downtime: a plain walkthrough of the chain's components. Generators, transfer switches, UPS, PDU, switchgear, transformers, and what each one does.
- Uptime Institute Journal, U.S. Bank Upgrades Its Data Center Electrical Distribution: a real distribution upgrade in a live facility, including the temporary stand-alone power plant built to keep the data center running while its switchgear and UPS systems were replaced.
- Uptime Institute (2025), Global Data Center Survey results: the outage analysis behind this lesson's UPS warning. Among power-related outages, UPS failures lead at 42 percent, ahead of transfer switches (36) and generators (28).
Case study: Release the Transformers?
The situation
Meridian Point Development has site control, a completed utility study, and a tenant letter of intent for its first building: two data halls, each served by two modular power centers of the standardized design this lesson reads. You are the development director. Schematic design is complete. Design development finishes in 18 weeks. The tenant's letter of intent targets energization at week 150, and your board wants that date protected at almost any reasonable cost.
The schematic single-line shows one 2500 kVA transformer per power center, four across the building. Your electrical engineer has flagged what the published record shows about this design. When the reference design went from schematic design to design development, the transformer changed. It shrank to a 2000 kVA padmount unit. It moved to the utility's side of the fence, supplied by the utility rather than bought by the owner. And the utility breaker picked up an arc flash containment requirement that appears nowhere in the schematic. Her warning is blunt: the transformer on the schematic may not be yours to buy at all.
The transformer vendor is offering terms now: a 112-week lead time from purchase order, with a production slot held for 30 days while the offer stands. Your construction manager has run the schedule math both ways (Exhibit D) and wants a decision this week. Waiting for design development puts transformer delivery 12 weeks past the date the building needs the units on site, unless the vendor can compress the schedule later at a price nobody has quoted. Ordering now means committing deposit money against a rating the published precedent says is likely to change, for a package the utility may end up supplying.
The board's instinct is to order. The engineer's instinct is to wait. Both can quote the same drawing.
The decision
Recommend one course of action and commit to it:
- Release the transformer purchase orders now, at the schematic rating.
- Wait for design development, and order at frozen ratings.
- Stage the commitment: secure the production slots now under terms that survive a rating change, and convert to full orders at design development.
Name the recommendation in one sentence, then defend it. State the one fact that, if it changed, would flip your answer.
How to solve it
- Read the schematic the way the lesson reads it. List the packages it actually commits you to, and mark which ratings are structural and which are placeholders.
- Use the published precedent. Identify exactly what changed between schematic design and design development in the reference design, and ask which of those changes would strand a purchase order placed today.
- Run the two clocks. The factory clock starts at purchase order; the design clock ends when ratings freeze. Put both on the Exhibit D timeline before pricing anything.
- Price the regret in both directions using Exhibit C: the cost of ordering wrong against the cost of ordering late. Use the case's numbers, not market forecasts.
- Commit. One recommendation, the conditions attached to it, and the fact that would flip it. A strong answer runs 400 to 600 words and spends most of them on steps 2 through 4.
Exhibits
- Exhibit A, the schematic design (the lesson's Figure 1): one utility feed and one 2500 kVA transformer per power center; two power centers per hall; two halls; four transformers in Building 1.
- Exhibit B, the published precedent (Uptime Institute Journal, 2014): at design development, the transformer for this design is a 2000 kVA padmount unit supplied by the utility, and the utility breaker sits in arc flash containment. See the lesson's Figure 2.
- Exhibit C, vendor terms (illustrative): lead time 112 weeks from purchase order; price $410,000 per unit; deposit 15 percent; a rating change before week 20 costs a re-specification fee of $18,000 per unit; cancellation after week 20 forfeits the deposit; the production slot offer expires in 30 days.
- Exhibit D, the schedule (illustrative): today is week 0; design development completes at week 18; transformers are needed on site at week 118; the energization target is week 150. Ordering today delivers at week 112. Ordering at design development delivers at week 130.
What not to use
- Do not redesign the building's electrical system or revisit how much redundancy it carries. The design is given.
- Do not renegotiate the utility's supply terms or assume a different utility offer. Who supplies the transformer at design development is a risk to weigh, not a term you control.
- Do not forecast transformer prices or vendor market conditions. Everything you need is in the exhibits.
Sources and fictitious entities
Public record: the design precedent is real. Uptime Institute Journal (2014), "Data Center Facility Owners See Modules as Efficient Way to Deploy Capital," documents the schematic and design development single-line diagrams this lesson reads, including the transformer change between them. Fictitious: Meridian Point Development, its people, and its tenant are invented for this case, and every dollar figure, lead time, and schedule week in Exhibits C and D is illustrative. This case uses only public record and clearly labeled hypothetical material; a learner inside a live engagement solves with sanitized observations only (no client names, no company names, no deal numbers, no identifying figures; any number rounded, anonymized, or labeled hypothetical).